Invariant Measures of Image Features From Phase Information
Peter Kovesi
If reliable and general computer vision techniques are to be developed
it is crucial that we find ways of characterizing low-level image
features with invariant quantities. For example, if edge significance
could be measured in a way that was invariant to image illumination
and contrast, higher-level image processing operations could be
conducted with much greater confidence. However, despite their
importance, little attention has been paid to the need for invariant
quantities in low-level vision for tasks such as feature detection or
feature matching.
In my research I have developed a number of invariant low-level
image measures for feature detection, local symmetry/asymmetry
detection, and for signal matching. These invariant quantities are
developed from representations of the image in the frequency
domain . In particular, phase data is used as the fundamental
building block for constructing these measures. Phase congruency can
be used as an illumination and contrast invariant measure of feature
significance. This allows edges, lines and other features to be
detected reliably, and fixed thresholds can be applied over wide
classes of images. Points of local symmetry and asymmetry in images
can be detected from the special arrangements of phase that arise at
these points, and the level of symmetry/asymmetry can be characterized
by invariant measures. It is also possible to perform signal matching
using correlation of local phase and amplitude information. This
approach allows reliable phase based disparity measurements to be
made, overcoming many of the difficulties associated with scale-space
singularities.
Some Results

Mandrill image
|
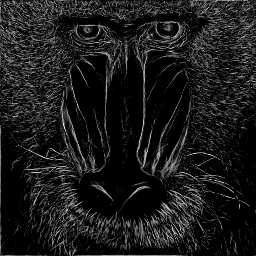
Raw phase congruency image obtained from phasecong.m. Phase
congruency is a dimensionless quantity, its value ranges between 0 and
1. Step and line features are marked equally well. Note how each
whisker has been marked as a single feature.
|
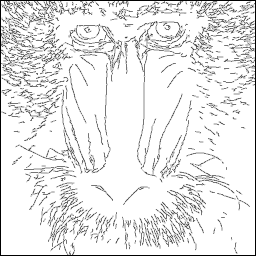
Phase Congruency edge map obtained after non-maxiam suppression
(using nonmaxsup.m) and hysteresis thresholding between phase
congruency values of 0.3 and 0.15 (using hysthresh.m).
|
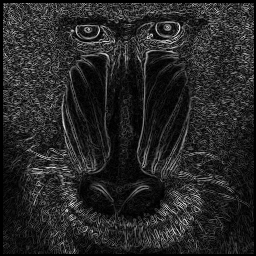
For comparison here is the raw Canny edge strength image (sigma =
1). Note how edges are marked on each side of each whisker.
|

Venice image
|
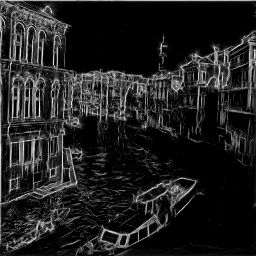
Raw phase congruency image. Notice the response of the detector
in the low contrast regions. Compare this to the output of the Canny
detector below. |
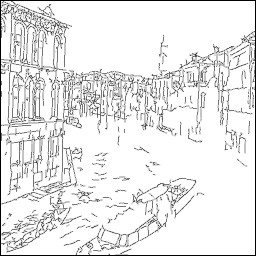
Phase congruency edge map obtained with non-maxima suppression and
hysteresis thresholding between phase congruency values of 0.3 and
0.15.
|
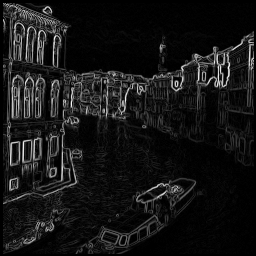
Raw Canny edge strength image (sigma = 1). Note how the response of
the Canny detector collapses in the low contrast regions.
|
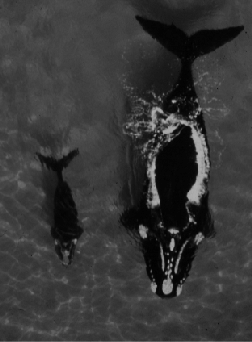
Whale image
|
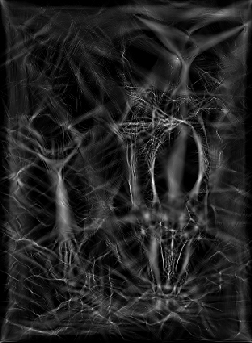
Raw phase symmetry image (obtained using phasecong.m). Phase
symmetry is a dimensionless quantity, its value ranges between 0
and 1. It detects symmetry of features independent of contrast.
|
|


