
February 2012
Images with a high dynamic range, such as aeromagnetic images, are difficult to present in a manner that facilitates interpretation. We present a method that compresses the dynamic range of an image while preserving and enhancing local features. The method is based on forming a 2D equivalent of the analytic signal via quadrature pairs of oriented log-Gabor filters to extract local phase and amplitude. The dynamic range of the image can then be reduced by applying a global tone mapping function to the amplitude values, for example taking the logarithm, and then reconstructing the image using the original phase values. An important attribute of this approach is that the phase information is preserved, this is important for the human visual system in interpreting the image. The result is an image that retains its essential features within a greatly reduced dynamic range. An additional advantage of the method is that the range of spatial frequencies that are used to reconstruct the image can be chosen to maximise the enhancement of local features. For aeromagnetic images this produces images that are a considerable improvement over the tilt derivative that is often used to compress the dynamic range. Tilt derivative images typically equalise anomaly amplitudes to an excessive degree and do not readily allow spatial frequencies of interest to be selected.
Paper:
Peter Kovesi, "Phase Preserving Tone Mapping of Non-Photographic High Dynamic
Range Images". Proceedings: Digital Image Computing: Techniques and
Applications 2012 (DICTA 2012). Available via IEEE Xplore
(preprint)
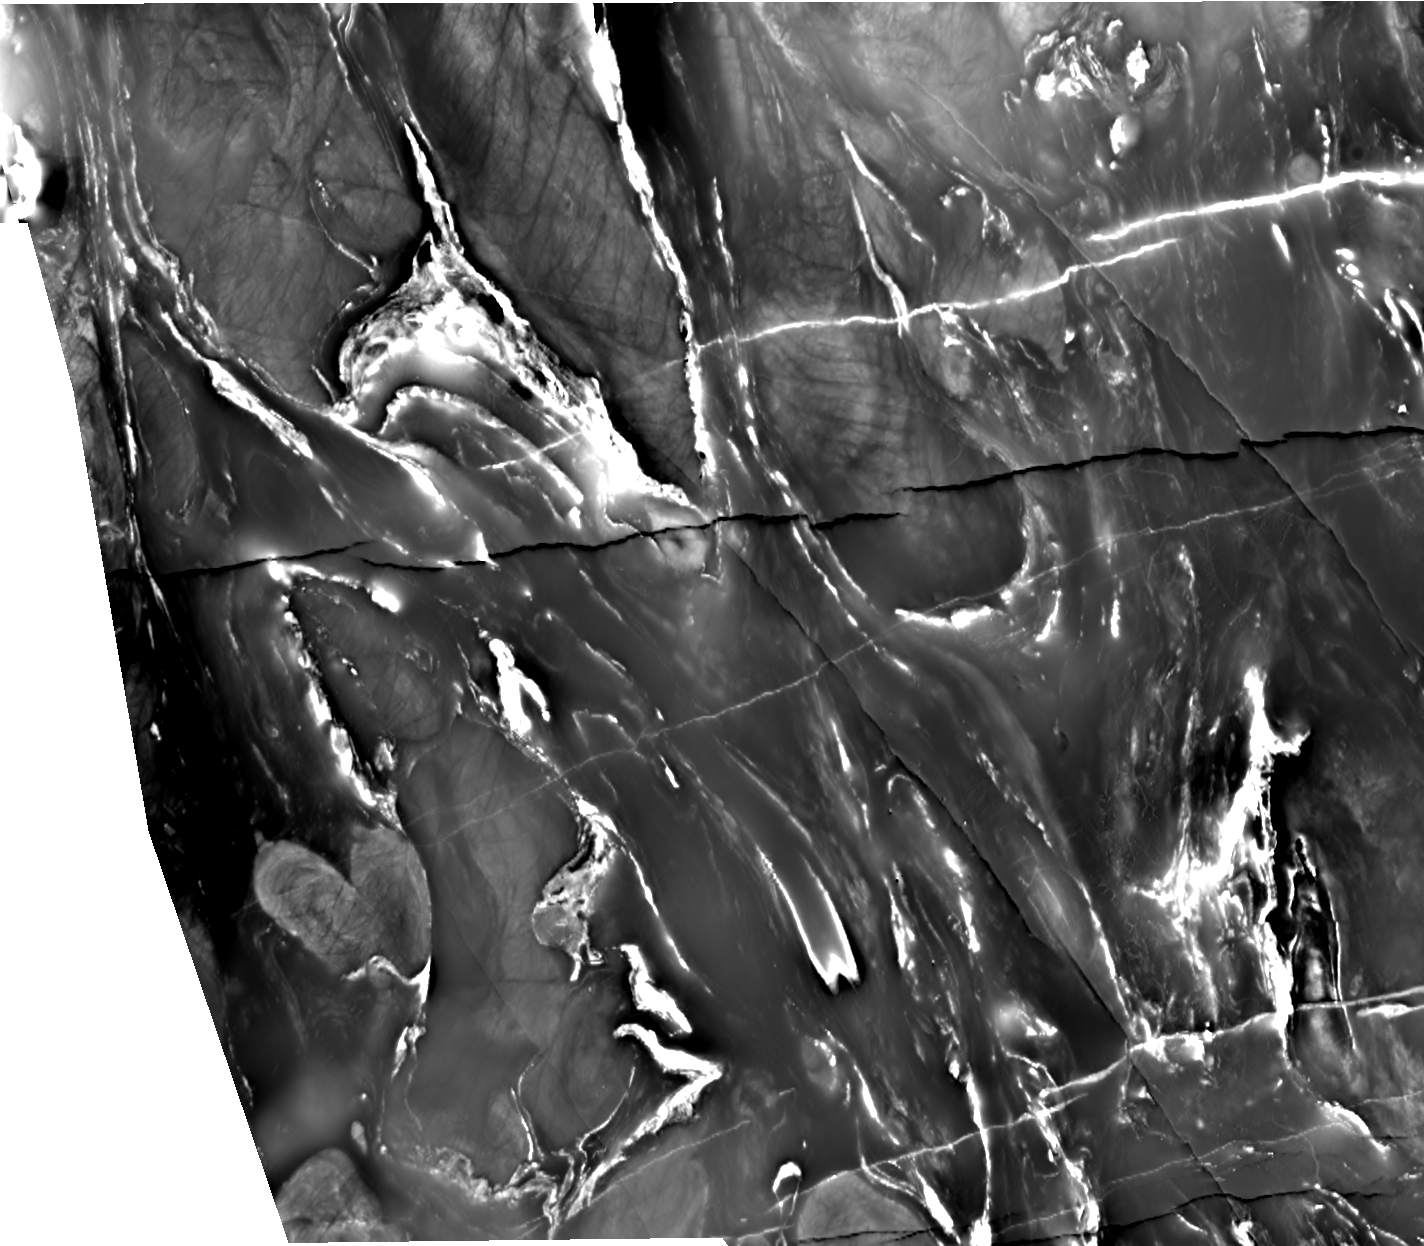
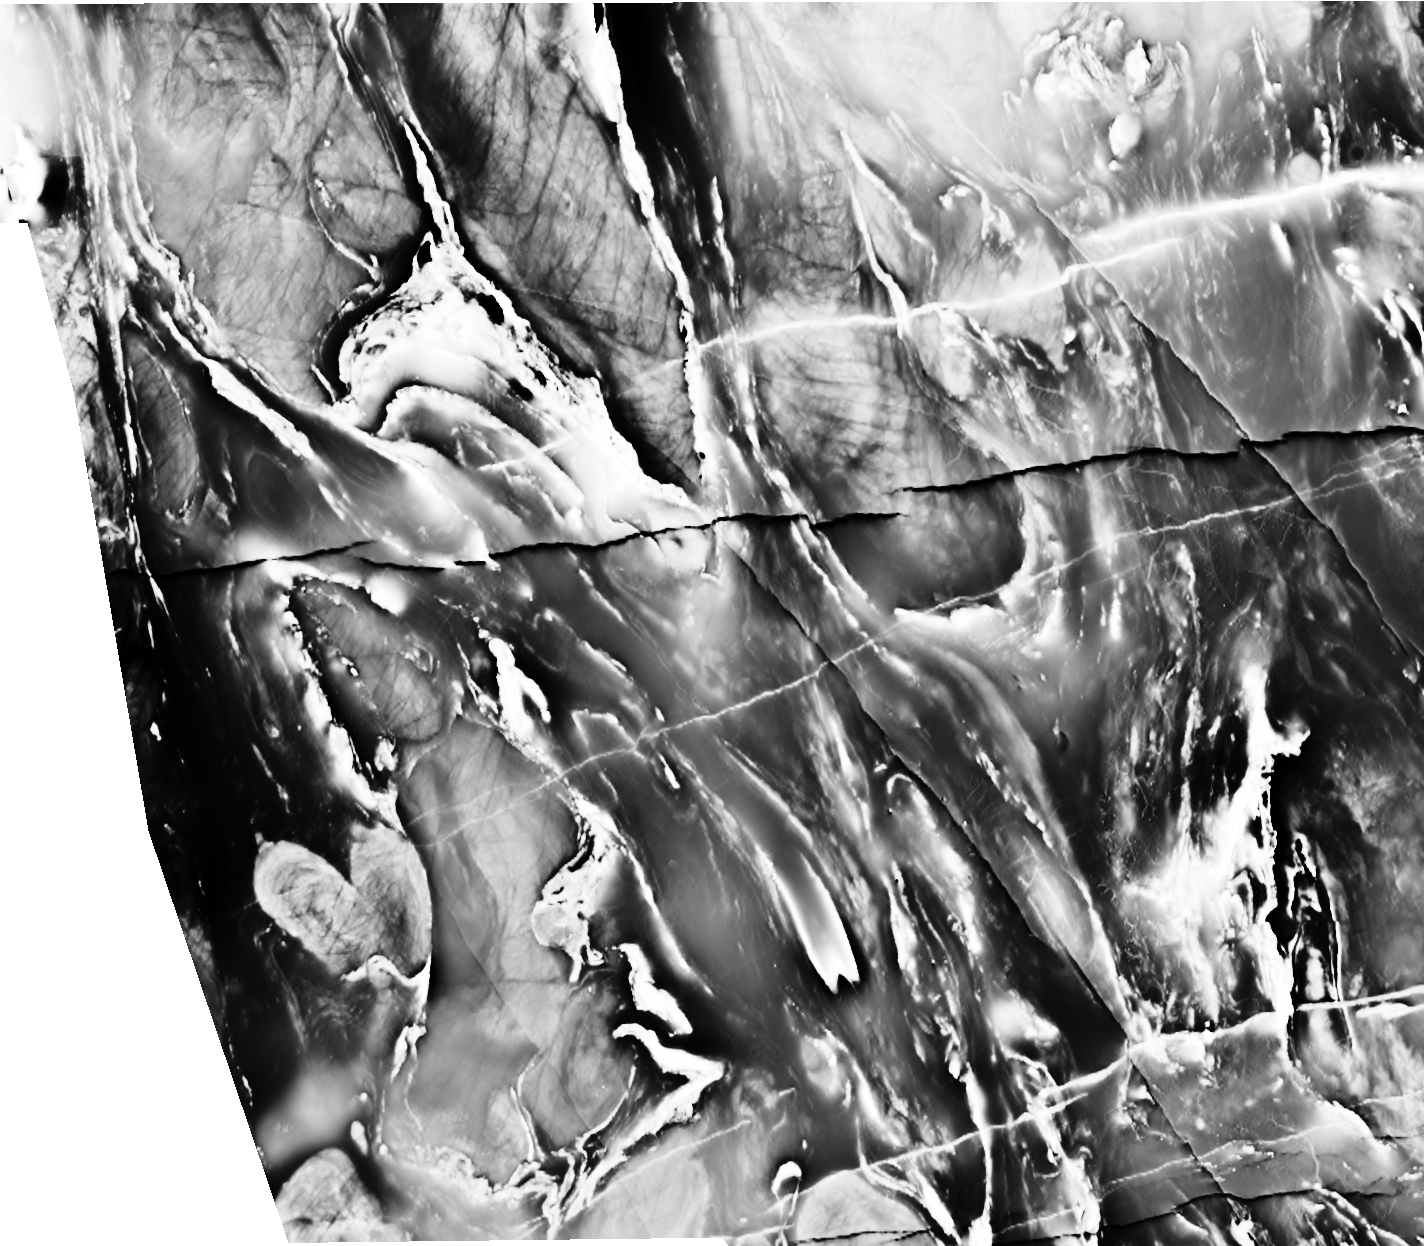
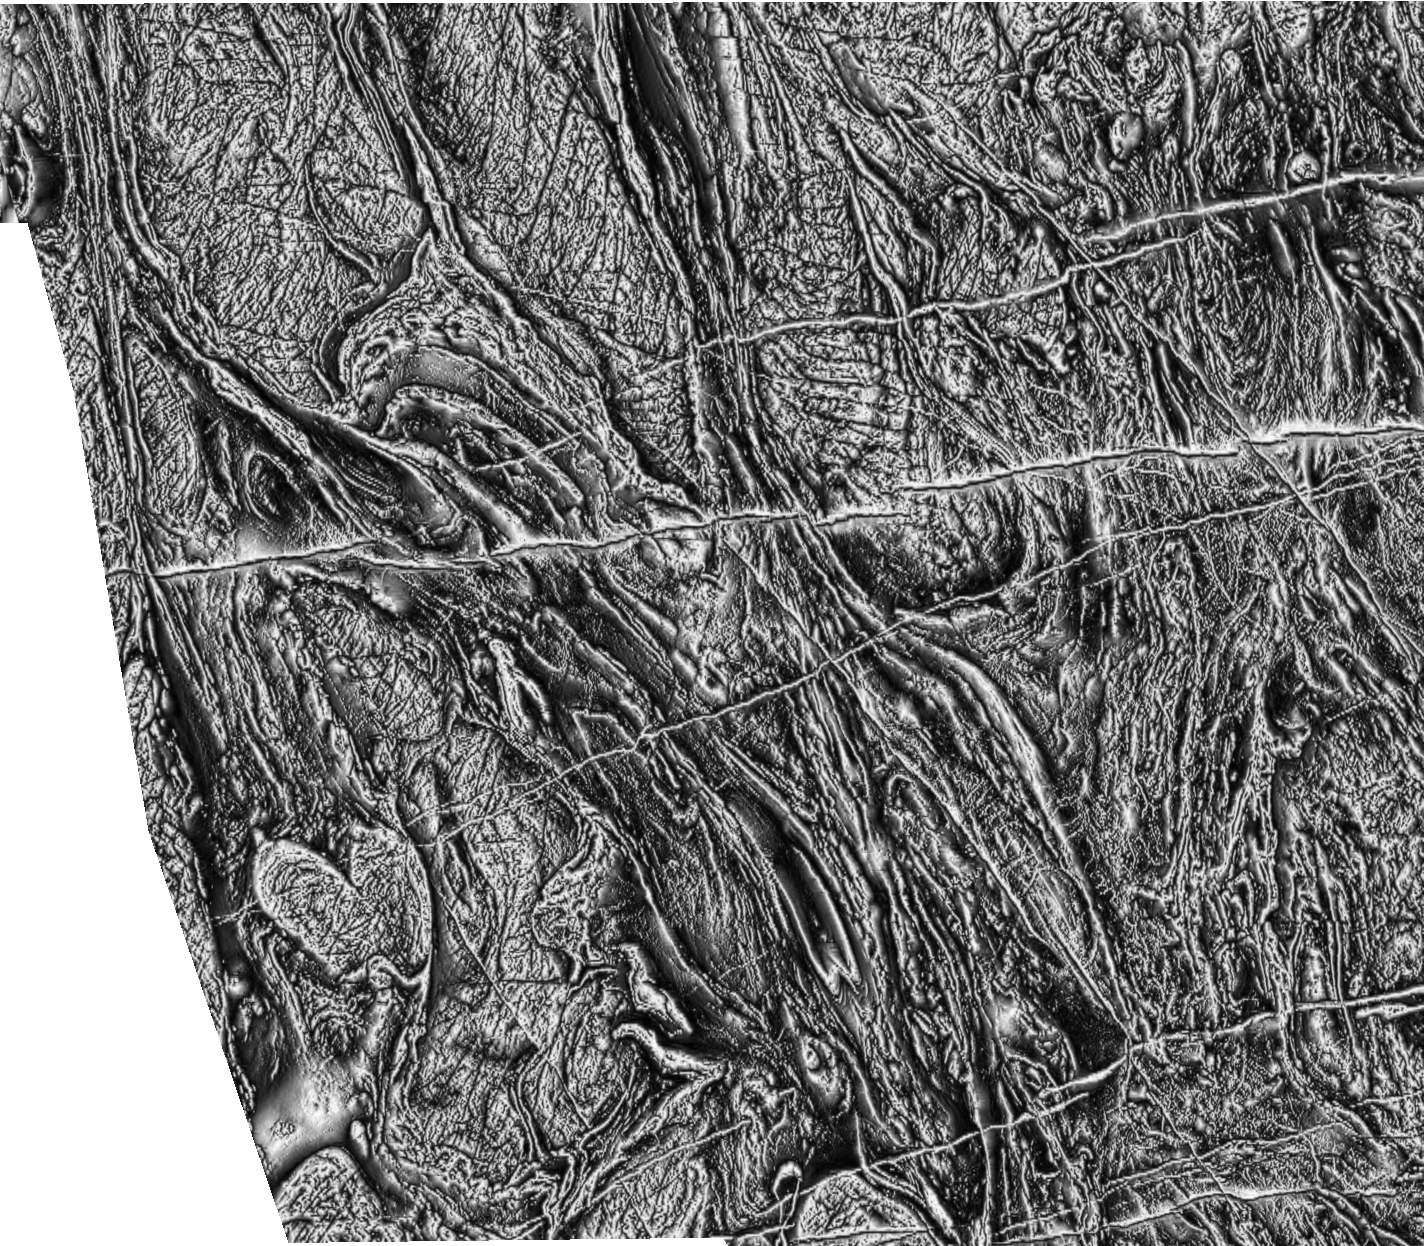
Here is a comparison of our dynamic range compression technique with some alternative presentation methods using data from the Yilgarn. The aeromagnetic data is the property of Fugro Airborne Surveys Pty Ltd.
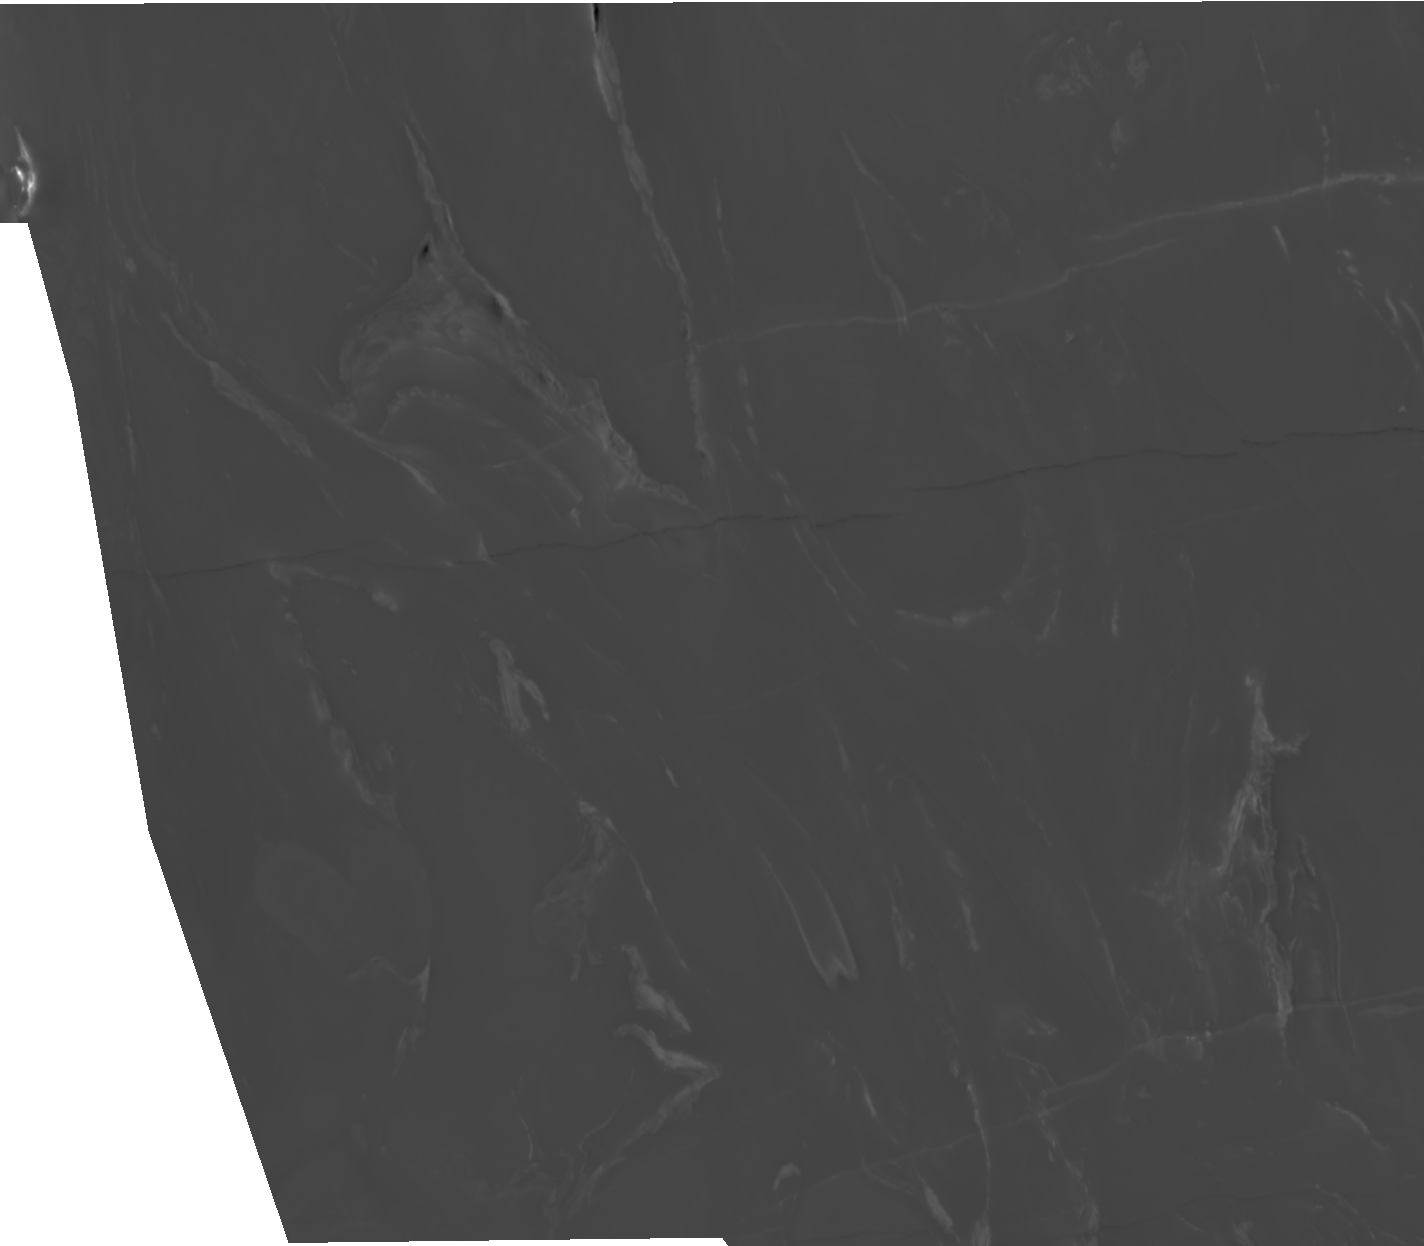
Original aeromagnetic data rescaled to a range 0-255.
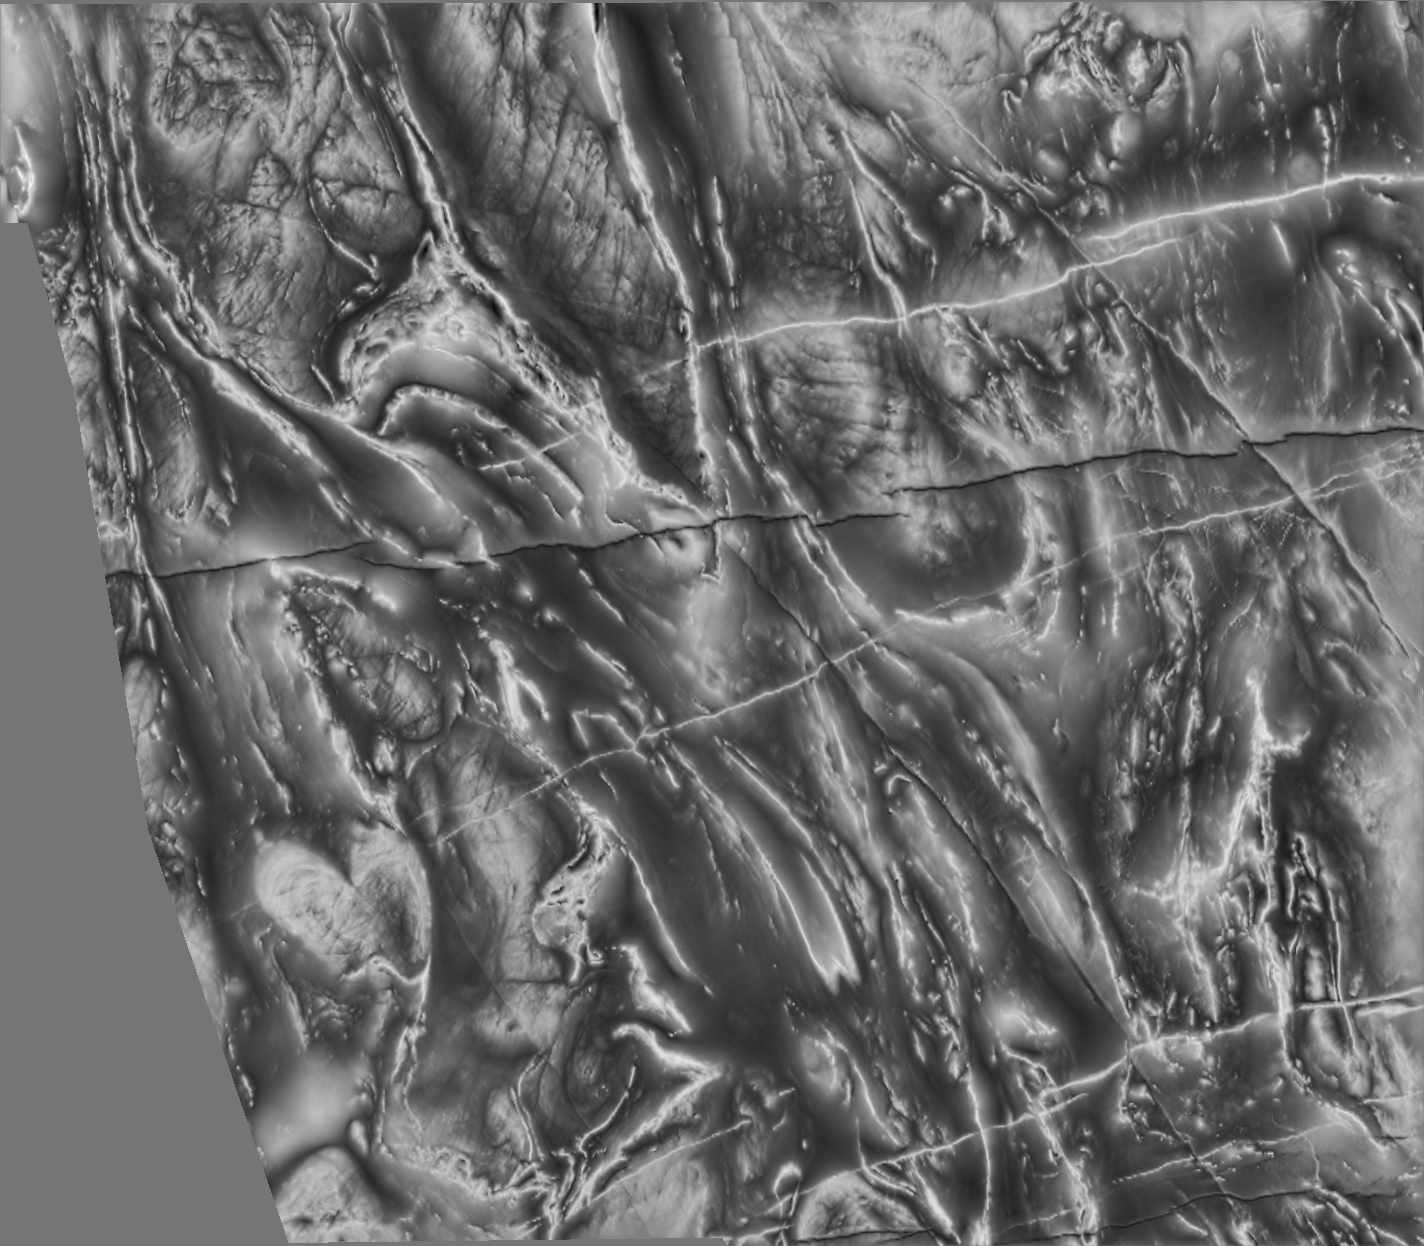
Data presented using our dynamic range compression algorithm.
If you have a current browser the movie below shows a section of the image presented at different scales of analysis. The scale is varied from fine to coarse over two sinusoidal cycles. However, it is perhaps more interesting if you manually drag the movie progress bar yourself to obtain interactive control over the scale that you view the data at.
Original data presented with the lower and upper 3% of the histogram saturated and a linear stretch for the data values between these limits. This simple operation displays the data quite well - apart from the areas that have been saturated.
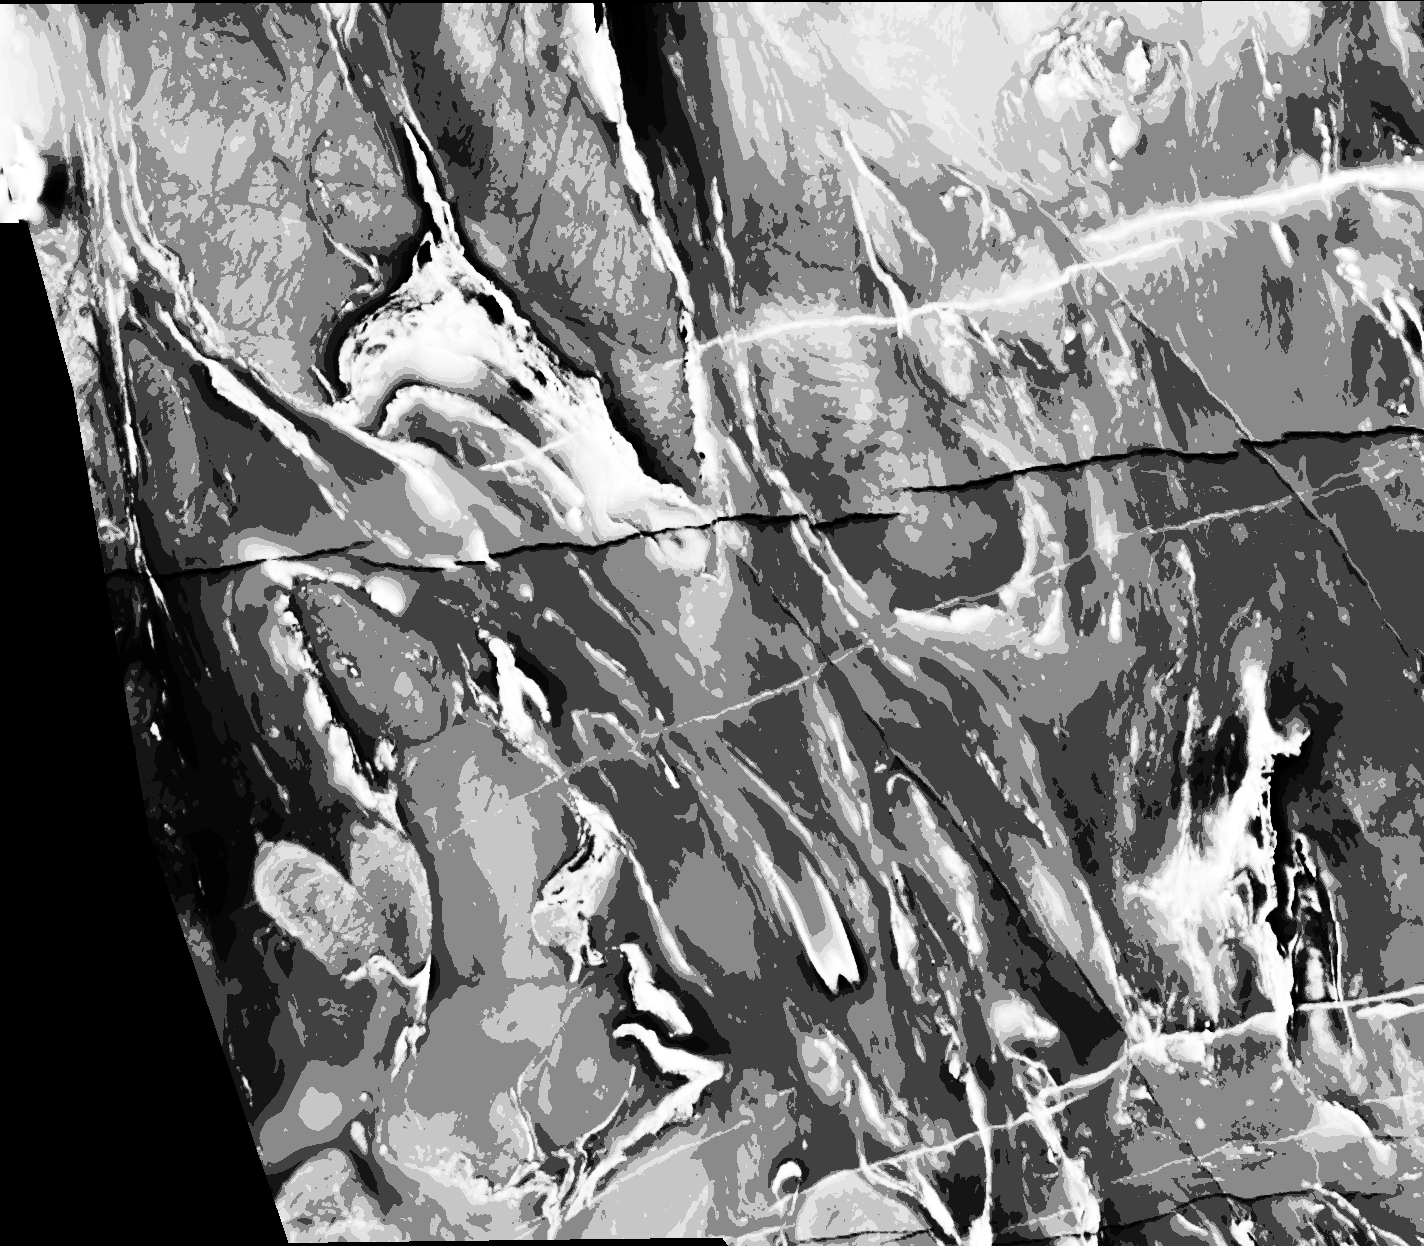
Original data after applying MATLAB's histogram equalisation. This is a rather poor result. MATLAB's code, like most implementations, involves integer rounding which means that typically the output image will have fewer distinct grey values than the input image. In this case, despite specifying that MATLAB's histeq should use 3000 histogram bins the output image only has 34 distinct values.
Original data after applying PK's floating point image histogram equalisation algorithm. Unlike MATLAB's histogram equalisation code this code generates an output image with the same number of distinct floating point image values as the input image.
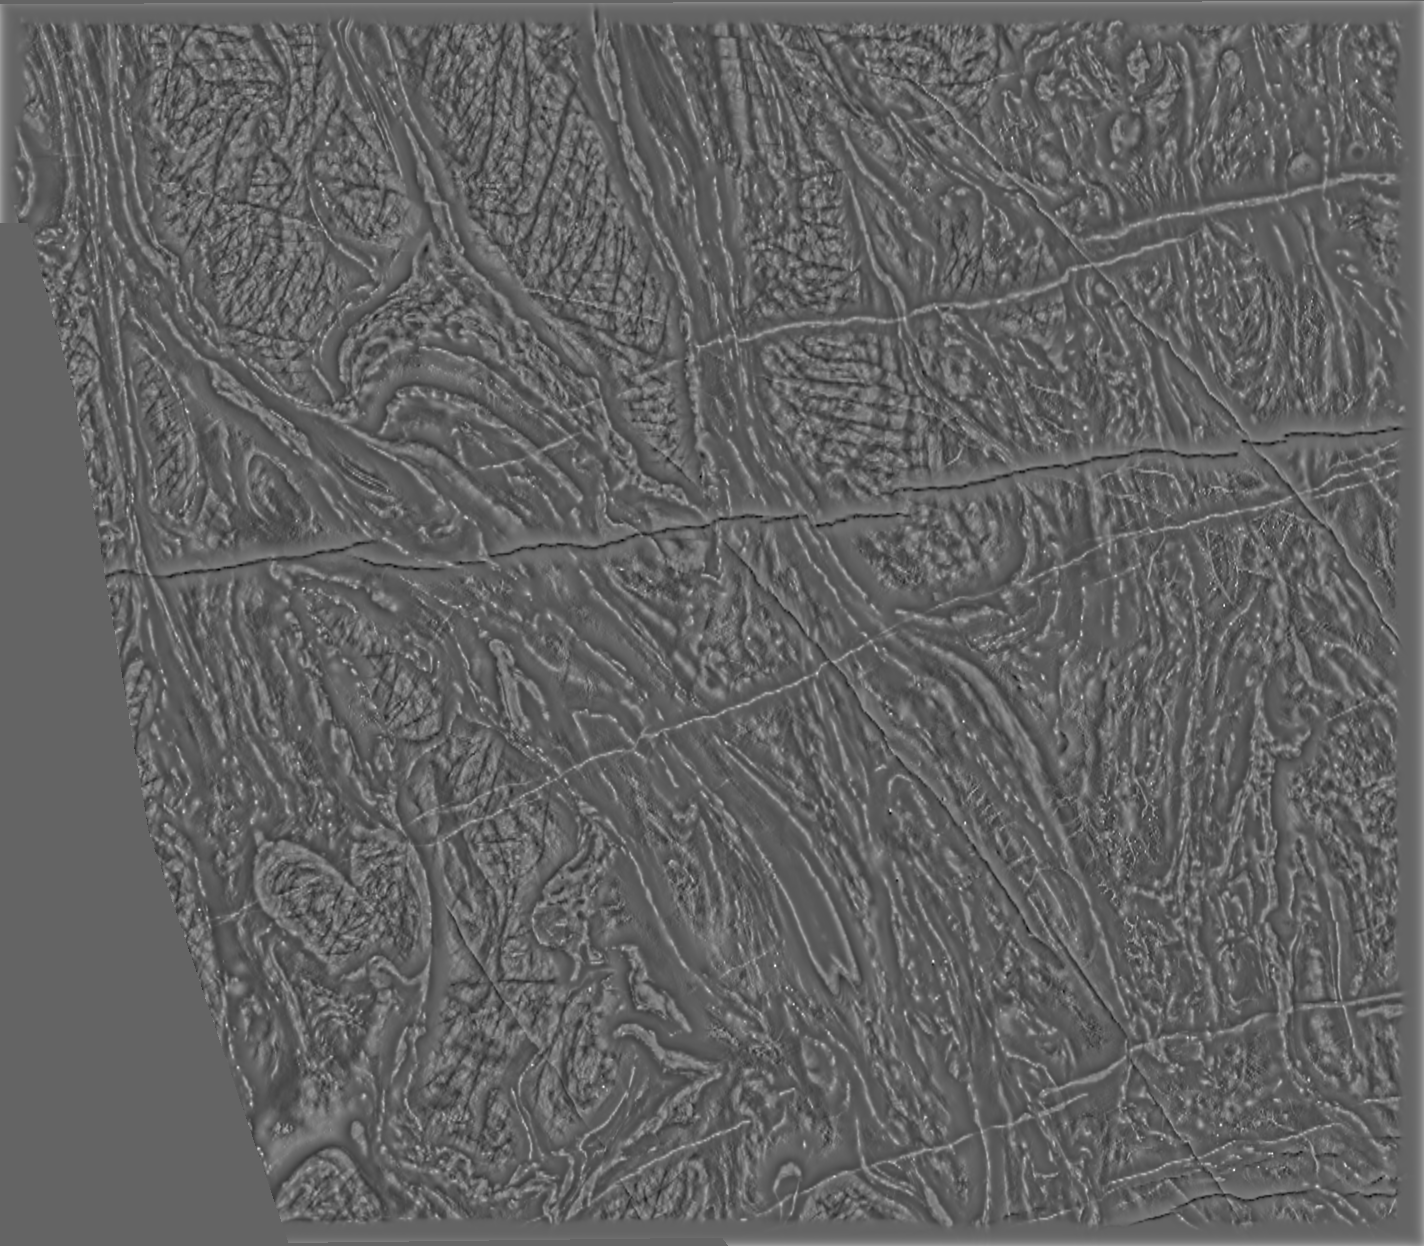
Image processed using a technique based on Rajagopalan's Automatic Gain Control algorithm. Images can be processed over a range of different scales, here I have chosen a scale that I think is reasonable for the technique.
Tilt derivative of original data. The anomaly amplitudes have been equalised to an excessive degree.