
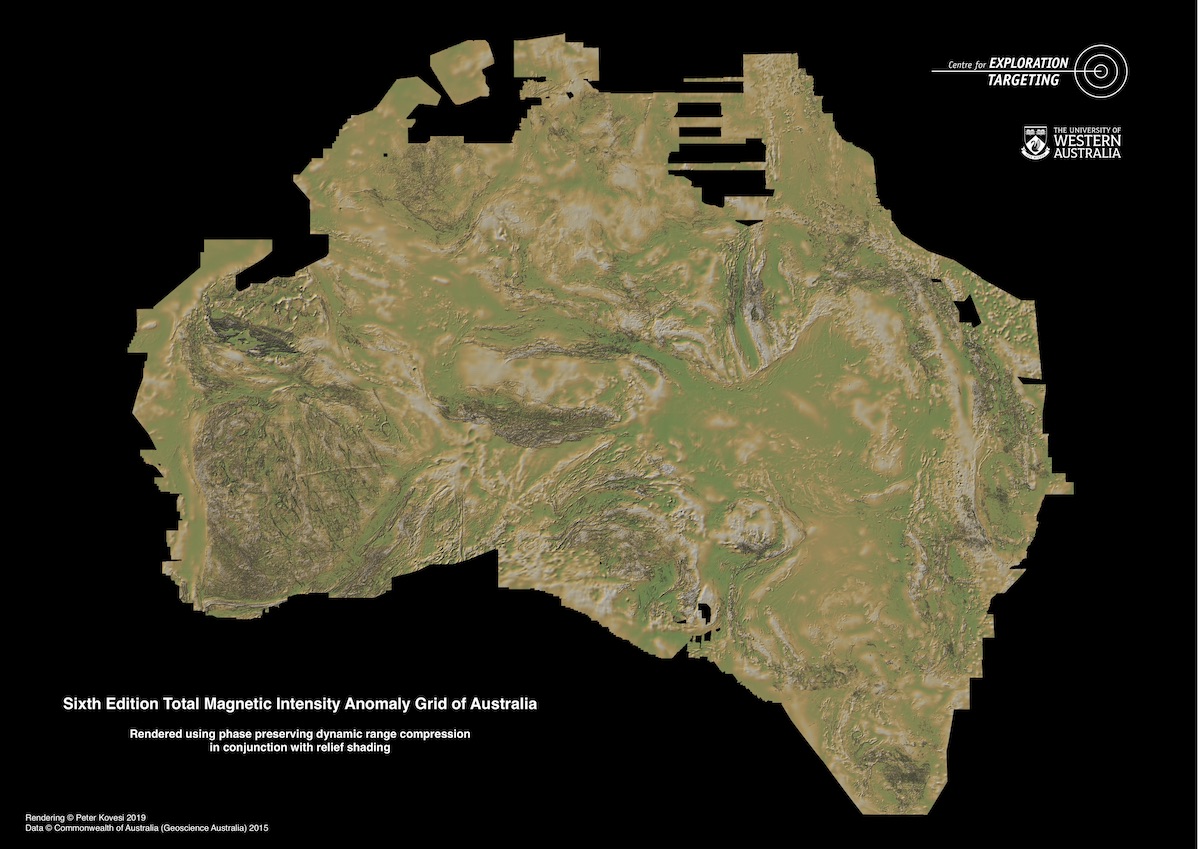
This image is a rendering of the "Sixth Edition Total Magnetic Intensity Anomaly Grid of Australia 2015" published by Geoscience Australia. The data represents the varying content of magnetic material in the earth's crust, primarily the iron oxide magnetite. Boundaries of extensive rock units can be mapped through the contrast of their magnetic material content relative to neighbouring rock units. Magnetic data typically has a very high dynamic range which makes it difficult to present in a manner that allows small features to be seen. Data values might range over 50,000 nanoteslas, but anomalies of interest may have magnitudes that are in the order of tens of nanoteslas.
To obtain this rendering I used relief shading in conjunction with my phase preserving dynamic range compression technique. Relief shading is very effective on high dynamic range images because it only depends on the gradient of the data, not on its raw values. However, while this allows the structure of the data to be seen very effectively we lose much of the sense of the raw data values. To overcome this we can use colour to restore some perception of the raw values. To do this the dynamic range of the raw data must be reduced in order to allow a colour map to be applied. This was done using phase preserving dynamic range compression. In this method the 2D analytic signal of the data is computed to obtain local phase and amplitude at each point in the image. The amplitude is attenuated by taking its logarithm and the signal is then reconstructed using the original phase values. A low contrast colour map was applied to this image and combined multiplicatively with the relief shaded image to obtain the final rendering seen above. An additional benefit of using colour in this manner is that it can amplify the 3D effect obtained from the relief shading.
To fully appreciate the rendering you should download a high resolution PDF of this poster here (47MB). View it at full resolution and scroll around within the image. Personally I am filled with wonder at the astonishing structures that are revealed.
Shown below is an earlier rendering of the "Fifth Edition Total Magnetic Intensity Anomaly Grid of Australia 2010" published by Geoscience Australia. Here I only used phase preserving dynamic range compression on the raw data with no relief shading.
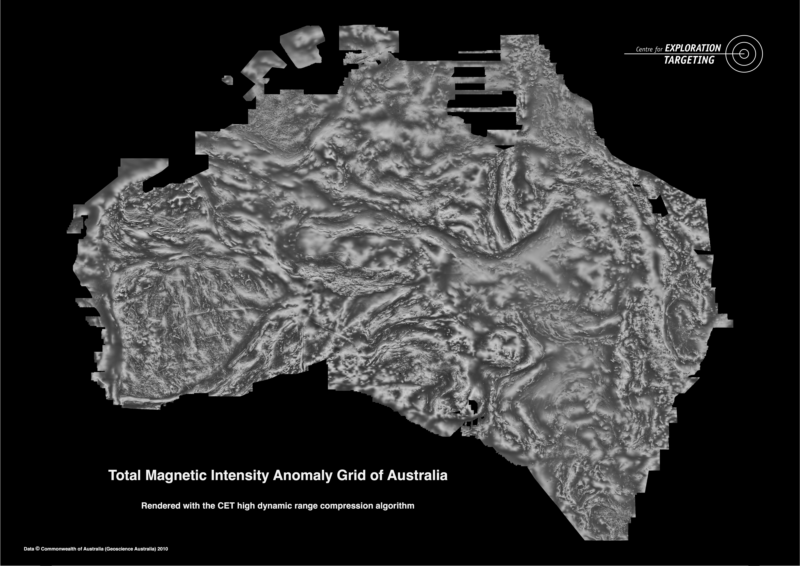
Download a high resolution image here.
For more information see: